
Padua, April 2013
In this article (wich will consist of 3 posts) I intend to compare the 3D Warehouse/Google Earth models made by us, human modelers, with the 3D Google Earth models obtained automatically using algorithms and techniques of photogrammetry.
These auto-generated 3D Models are actually [April 2013] shown by default [at least for Google Earth Version 7.0.2 for Windows Vista] in the experimental stage in some areas of the world [including the center of the city of Rome] in the photorealistic layer of Google Earth.
Here I would like to make a constructive contribution to the knowledge and deeper understanding of this important and strategic matter exposing what seem to me - as of today - the pros and cons, the advantages and disadvantages of the two extreme alternatives, assuming and hoping that in the future may be taken more flexible choices that would maximize the benefits and minimize the disadvantages.
Enrico Dalbosco (Arrigo Silva)
AUTO-GENERATED 3D MODELS
PART 1
ENVIRONMENT
© Enrico Dalbosco (Arrigo Silva) April-May 2013
Last update: Apr 29, 2013
Index of contents
PART 1 - ENVIRONMENT <== Current Post
1. Introduction
2. The most common Scenarios representing the Earth
3. My early observations on the Scenarios
1. Introduction
2. The most common Scenarios representing the Earth
3. My early observations on the Scenarios
PART 2 - A VISUAL CONFRONTATION <== Click Here To Read PART 2!
4. Man VS Machine: A Visual Comparison between Scenarios X,Y
5. The Visual Characteristics of the Scenarios X,Y
5.1 The Visual Impression Summary Table
5.2 Comparing the Scenarios X,Y according to the Visual Impressions
4. Man VS Machine: A Visual Comparison between Scenarios X,Y
5. The Visual Characteristics of the Scenarios X,Y
5.1 The Visual Impression Summary Table
5.2 Comparing the Scenarios X,Y according to the Visual Impressions
PART 3 - WHAT FUTURE... ? <== work in process
More about 3D representation / Factors which influence the evaluation of the Scenarios / Pros and Cons for the USERS and SUPPLIERS / What future for the current 3D Warehouse modelers? / Conclusions
More about 3D representation / Factors which influence the evaluation of the Scenarios / Pros and Cons for the USERS and SUPPLIERS / What future for the current 3D Warehouse modelers? / Conclusions
Prologue
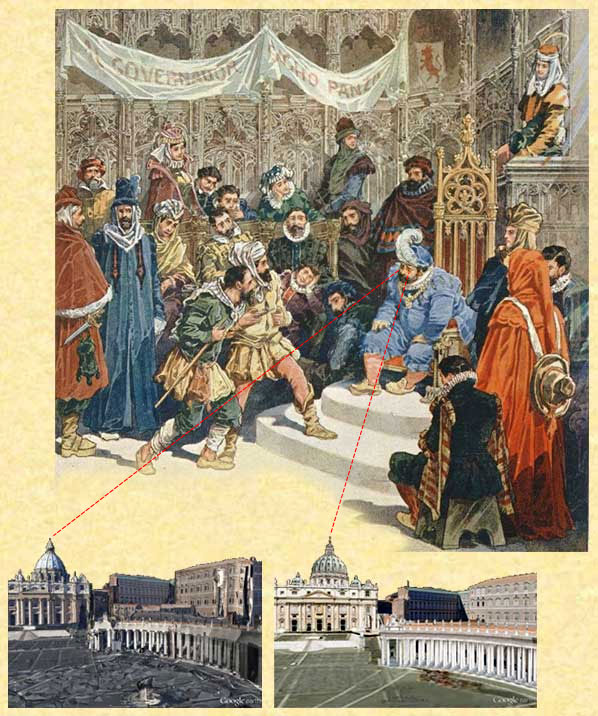
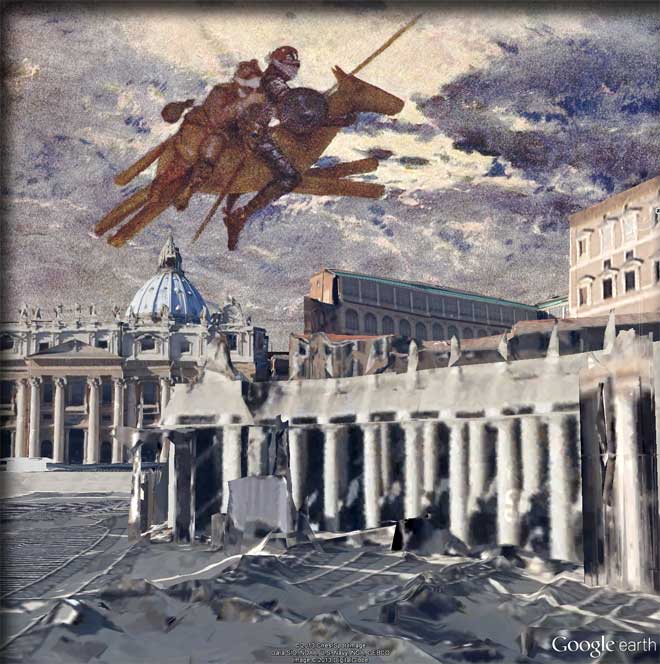
A difficult choice for our Sancho Panza, as a new judge of Barataria! They ask him to judge whether are better the models produced directly by humans or by machines and algorithms produced by humans... But don't warry: he knows how to draw himself out of trouble in embarrassing situations!
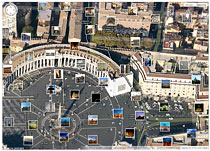
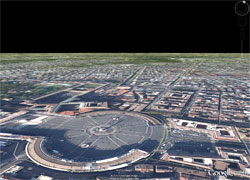
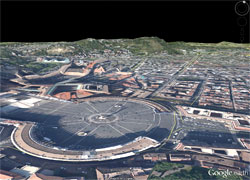
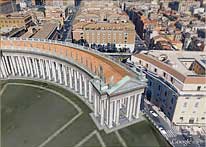
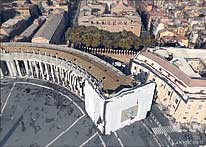
The picture on the lower left represents a view of Saint Peter's Square with auto-generated 3D objects (as of April 22, 2013) while that on the right shows 3D models hand-created by 3D Warehouse modelers - in the foreground you can see my 3D model of St Peter's Basilica with Bernini's Colonnade (placed in 3D Warehouse at January 3, 2011). Later in this article I will take you through several other detailed pictures of these two scenarios.
The picture on the lower left represents a view of Saint Peter's Square with auto-generated 3D objects (as of April 22, 2013) while that on the right shows 3D models hand-created by 3D Warehouse modelers - in the foreground you can see my 3D model of St Peter's Basilica with Bernini's Colonnade (placed in 3D Warehouse at January 3, 2011). Later in this article I will take you through several other detailed pictures of these two scenarios.
0. Summary
[ ... work in process ... ]
1. Introduction
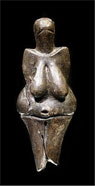
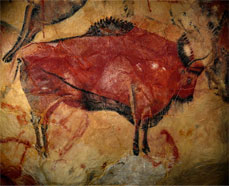 Since the dawn of so-called civilization the human beings have had a vocation and aspiration to represent the world around them, starting from animals and human beings themselves, and to provide these representations in a variety of ways and with many different materials - I reported here on the side the very well known 2D and 3D representations that date back more than 10,000 years ago.
The reasons that led the human race to these representations are likely to be religious, practical and perhaps even purely aesthetic.
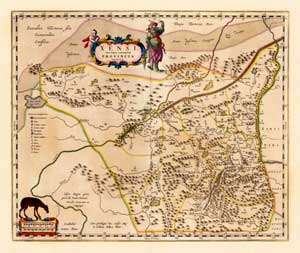
In more recent times (and already in the historical period) the humanity began to represent also its territory, and the geometry gave a great impetus to the science of measuring (-metry) the earth (geo), first as a "land to cultivate," and then as "world to conquire" or "world through which travel". Thereby were born the first 2D cartographic representations that have been gradually refined reaching in the nineteenth century a very high degree of precision.
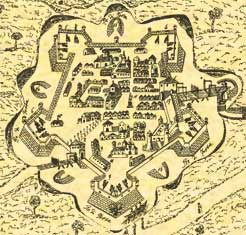 Since the Middle Ages appeared the first ......3D representations, mainly relating to mountain areas and towns - a major boost to this type of representation has been given by the perspective and axonometric representation. These images, initially imprecise and very rough, had a big improvement with the advent of photography (mid-nineteenth century) and especially of aerial and satellite photography. It was thus possible to take virtually every inch of our planet and to give representations with an accuracy which is now in the order of the meter (if not also even in the fraction of a meter) and with views of ground-level type "street" or with aerial images orthogonal to the ground or with various isometric views.
 The irrepressible desire of humankind to represent the world is plastically illustrated by Jorge Luis Borges, the great visionary, who tells us the history of the Emperor of China Qin Shi Huang who asked his cartographers craftsmen to build the most perfect possible map of his great empire. He, obsessed by the desire to obtain a map as accurate and detailed as possible, ordered an exact double of his empire's domain, in wich each mountain, castle, house, tree, person, until the last grain of sand would find its exact copy - and ended up by having made a map so perfect to cover the whole territory to be represented...
 2. The most common Scenarios representing the Earth (in 3D)
But let's now jump into the present day, and see how many and which are the most common Scenarios representing the world (ground + roads, houses, bridges, buildings etc.)
Warning: in this discussion I want as much as possible, regardless from commercial products, manufacturers or brands, to provide only some basic concepts without claiming to provide a "scientific" description of the various representations.
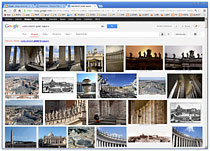 A1) "Pictures Collection"
A pictures collection (or Database of Images) searchable for keywords, for example "Rome St Peter", like google/images, flickr and many others.
Notes: each supplier offers its users a number of additional features of search, selection, filter etc.
 A2) "Geolocated Pictures Collection"
A pictures collection (or Database of Images) mainly oriented to the Earth terrain, that presents the geo-tagged photographs placed at the point (identified by geographic coordinates) in which they have been taken (or in which is the represented object).
Notes: each supplier offers its users a number of additional features.
 B1) "Planet Earth 2D-Flat View"
It provides the illusion of viewing the flat terrain of an Earth in the form of a perfect sphere flying in a plane that can move in any direction and at any height from the ground, with the further possibility to turn the gaze in any direction.
Notes: the illusion is provided using orthogonal photographs of the terrain seamless glued.
 B2) "Planet Earth 3D-Relieved View"
It provides the illusion of viewing the relieved terrain of the Earth flying in a plane that can move in any direction and at any height from the ground, with the further possibility to turn the gaze in any direction.
Notes: the illusion is provided using photographs seamless glued (as in A1) projected on unevennesses of the actual Earth terrain (with hills, mountains, etc.)
 C) "Street View"
It provides the illusion of moving on some "fixed routes" (usually the main roads) across the world on foot (from a constant height of about 3 meters) and to be able to turn the gaze almost in any direction.
Notes: the illusion is provided using "panoramic photographs" taken at appropriate intervals (tens of meters) along the routes.
 D) "Aerial Oblique 4x"
It provides the illusion to fly over the world in a plane traveling at a constant height from the ground with the four possible canonical inclinations (that allow you, for instance, to see "the four sides" of a parallelepiped-shaped building).
Notes: the illusion is provided using four sets of axonometric photographs (seamless connected) and canonically inclined at the four cardinal points.
 Y) "Planet Earth + 3D Models hand-made"
It provides the illusion to fly over the actual world (terrain+building etc.) in a plane that can move in any direction and at any height from the ground, with the further possibility to turn the gaze in any direction.
Note: the illusion is provided using a large number of 3D models that represent the objects that protrude from the terrain; these 3D models have been hand-created by 3D modelers.
 X) "Planet Earth + 3D Models auto-generated"
This scenario is analogous to the previous, with the difference that the 3D models are created and maintained automatically by standardized procedures using appropriate techniques and algorithms of Photogrammetry.
Two words about Photogrammetry
Refer to: http://en.wikipedia.org/wiki/Photogrammetry
Photogrammetry can be understood with a set of principles, criteria, techniques and tools to automatically get a "3D model", complete of geometry and textures, starting from a set of photographs taken according to appropriate standards. In principle, the photographs are scanned and analyzed using sophisticated techniques of pattern recognition in order to identify discontinuities and thus to define the edges, faces and textures, and all the information necessary to define a complete 3D model.
The following pictures can give you a first idea of this technique.
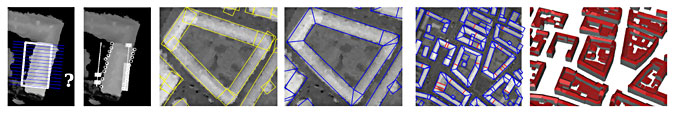 These illustrations were taken from the publication An automatic building extraction method: Application to 3D-city modeling by Florent Lafarge — Pierre Trontin — Xavier Descombes — Josiane Zerubia — Marc Pierrot-Deseilligny - INRIA Institut National de Recherche en Informatique et en Automatique, May 2006.
You can gather other info searching Google for Automatic 3D city modeling, or Photogrammetry or similar keywords. From your research you will notice that papers and news are rather few and often not significant - I think that this happens not because these topics are not of current interest, but because they are of great importance even from a commercial point of view - but this is only my humble opinion.
3. My early observations about the Scenarios
In Table 1 below I present a summary of the scenarios described above, also providing - for each scenario - some objective information (INPUT, COVERAGE, NAVIGATION) plus my estimates with respect to the degree of interest that the scenarios may have for certain TYPES OF USERS and finally my qualitative estimate of managerial and organizational complexity (and, therefore, EFFORT) required by a hypothetical organization to create it and keep it updated.
Legend:
INPUT = the main information that constitutes the input of the scenario
COVERAGE = areas of Earth covered by the scenario
NAVIGATION = human-machine interface complexity for the navigation in the scenario
B.Traveler = degree of interest for the scenario from ...people who travel the world for business
Tourist = ...people who travel the world for fun, curiosity, knowledge
Lover = ...people who travel (or who want to learn more) for hobby, passion or work
EFFORT = managerial and organizational complexity related to the scenario
* to *** = DEGREE OF INTEREST from low to high
+ to ++++++ = EFFORT from low to very height
TABLE 1 - Most Common Scenarios Representing Earth (in 3D) | |||||||
| INPUT | COVERAGE | NAVIGATION | TYPES OF USERS | EFFORT | |||
| Traveler | Tourist | Lover | |||||
| A1) Pic Collection | photos | pratically the whole earth | [s.engine] | * | *** | *** | + |
| A2) Pic Geolocated | terrain + photos | pratically the whole earth | simple | ** | *** | *** | + |
| B1) Earth Flat | aerial orthogonal photos | pratically the whole earth | simple | * | * | - | + |
| B2) Earth Relieved | 3D elevations + aerial orthogonal photos | pratically the whole earth | intermediate | ** | ** | * | ++ |
| C) Street View | panoramic photos at head height | selected areas | complex | *** | *** | ** | +++ |
| D) Oblique 4x | aerial 4x axonometric photos | selected areas | simple | *** | *** | ** | +++ |
| Y) Hand 3D Models | photos, papers, culture,... | selected areas + leopard's spots | complex+ | ** | ??? see later | ??? see later | ++++++ |
| X) Auto 3D Models | aerial axonometric photos (+ other photos) | selected areas | complex+ | ** | ??? see later | ??? see later | +++ |
Warning: the values assigned to the columns are the result of my personal opinions and evaluations, but I would be happy to know the opinions and evaluations of the readers!
As can be seen from the table, the current offer is very diverse and rich and that Scenarios A, B, C, D cover very well - at least in my personal opinion - the needs of users (if not perhaps their expectations!?)
And you can also see that in Scenarios X, Y I left deliberately incomplete [???] some estimates, also by virtue of the fact that their discussion will be carried out in the following sections.
END OF PART 1

ON THE NEXT PARTS...
When I started writing this article, 10 days ago, I did it under the... quixotic displeasure (euphemistic expression) to see the 3D model of St. Peter's Square in Rome made by a machine placed by default instead of my hard-earned model.
 But after this first impulse (and although I am still sorry for the default) I wanted to look deeper into the problem, I did some research on the web and I analyzed more carefully the auto-generated images comparing them with those of the models created by 3D modelers - and I also tried to put myself in the shoes of the Scenarios Providers...
Without anticipating the contents of the upcoming episodes, which will be filled with images, tables and considerations, I can say that - after all - the devil is not always as bad and ugly as he is painted...
Let us compare, for example, the two images of Don Quijote with Sancho who ride the prodigious Mechanical Horse Clavileno above St. Peter's Square "auto-generated" as in Scenario E2.
I don't know what you think of them, but I say that the first image, that big (about 650x650 pixel), is very difficult to digest...
Then look at that little image below: it is exactly the same as that big, apart from the size - but...
.

No comments:
Post a Comment